In an era defined by “Big Data,” statistics has become the silent engine driving the modern world. It is the science of learning from data, providing the tools to navigate a reality that is fundamentally uncertain. From the algorithms that curate your social media feed to the clinical trials that determine the safety of new life-saving medications, statistics is the bridge between raw, chaotic information and actionable knowledge.
In this exploration, we will journey through the foundational concepts of statistical thinking, the power of distributions, the nuances of inference, and how the “statistical revolution” of 2026 is transforming everything from sports to environmental policy.
1. Beyond the Average: Understanding Data
At its simplest level, statistics is about describing a set of data. We often start with “Measures of Central Tendency”—mean, median, and mode—to find the “middle” of a dataset. However, an average rarely tells the whole story.
The Power of Dispersion
To truly understand a dataset, we must look at its variance and standard deviation. These metrics tell us how “spread out” the data is. A high standard deviation in test scores might suggest a wide gap in student understanding, while a low one indicates a consistent level of performance. In 2026, understanding dispersion is critical for supply chain management, where consistency is often more valuable than a high average.
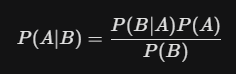
2. Probability: The Foundation of Statistics
Statistics and probability are two sides of the same coin. Probability is the study of random processes; statistics uses those processes to make sense of observations.
-
The Law of Large Numbers: This principle states that as the number of trials increases, the actual results will converge toward the expected theoretical probability. This is why casinos always win in the long run, even if a single gambler has a lucky night.
-
The Central Limit Theorem: This is the “magic” of statistics. It states that if you take enough samples from any population, the distribution of the sample means will follow a normal distribution (a bell curve), regardless of the shape of the original population. This allows statisticians to make precise predictions about very complex, messy systems.
3. Statistical Inference: Drawing Conclusions from a Part
We rarely have access to an entire “population” (like every person on Earth). Instead, we work with a sample. Statistical inference is the process of using that sample to make an educated guess about the whole.
Hypothesis Testing and P-Values
How do we know if a new drug actually works, or if the results were just a fluke? We use hypothesis testing. We start with a “Null Hypothesis” (the drug does nothing) and see if the data provides enough evidence to reject it. The p-value is the probability that we would see our results if the null hypothesis were true. In 2026, the scientific community is moving toward more nuanced “Confidence Intervals” rather than relying solely on the binary “significant vs. non-significant” p-value.
4. Correlation vs. Causation: The Ultimate Trap
One of the most important lessons in statistics is that just because two things happen together doesn’t mean one caused the other. Ice cream sales and shark attacks are highly correlated, but that’s because they both increase during the summer (the “hidden variable” of heat).
In 2026, Causal Inference is a burgeoning field. Using sophisticated “Bayesian Networks,” statisticians are now able to disentangle complex webs of variables to determine true cause-and-effect relationships in areas like climate change and economic policy.
5. Regression: Predicting the Future
Regression analysis allows us to model the relationship between variables. A “Simple Linear Regression” might predict a person’s height based on their parents’ heights. More complex “Multiple Regressions” can predict house prices by looking at square footage, location, school district ratings, and local interest rates simultaneously.
In the modern world, regression is the basis of Predictive Analytics. Retailers use it to predict which products will trend next month, and meteorologists use it to refine hurricane path projections.
6. Statistics in 2026: The New Frontiers
The role of the statistician has evolved into that of the “Data Scientist.” Here is how statistics is shaping our immediate future:
-
Algorithmic Fairness: As AI makes more decisions—from hiring to loan approvals—statisticians are working to ensure these models aren’t biased. By auditing the underlying data distributions, they can detect and correct for systemic inequities.
-
Precision Medicine: Instead of “one size fits all” treatments, statistics allows doctors to analyze a patient’s unique genetic markers against vast databases to find the most effective treatment for that specific individual.
-
Sports Analytics: Beyond the “Moneyball” era, teams now use “Spatial Statistics” to track every player’s movement in real-time, calculating the probability of a successful play from any point on the field or court.
7. Conclusion: Thinking Statistically
To think statistically is to embrace a more honest view of the world. It is the realization that “anecdotes are not data” and that “certainty” is an illusion. By learning to interpret the language of uncertainty, we become better consumers of information, more effective problem solvers, and more informed citizens.
Statistics is more than just a branch of mathematics; it is the essential toolkit for the 21st century. Whether you are looking at a political poll, a financial report, or a medical study, the ability to “see through the numbers” is perhaps the most powerful skill one can possess in 2026.