The Architecture of Evidence: A Masterclass in Statistics

Statistics is the art of making sense of the chaos. This post explores how we use descriptive metrics to summarize the world and inferential logic to predict its future. From the $P$-values that validate medical breakthroughs to the Bayesian models that power your favorite apps, discover how the “architecture of evidence” turns raw numbers into the truth.

Statistics is often described as the “science of data,” but that definition is like describing a symphony as a “collection of notes.” In reality, statistics is the fundamental architecture of evidence. It is the bridge between the chaotic, overwhelming noise of raw information and the clear, actionable signals we use to make decisions. From the medication in your cabinet to the predictive text on your smartphone, statistical models are the invisible engines driving our modern world.

In this deep dive, we will explore the three pillars of statistical science: Descriptive Statistics, Inferential Statistics, and the Practical Application of these tools in our daily lives.


1. Descriptive Statistics: Mapping the Known World

Before we can predict the future or make generalizations, we must understand the “here and now.” Descriptive statistics provide the tools to summarize and visualize the data we currently have. Imagine you are looking at the test scores of 10,000 students. Without a way to condense that information, it is just a wall of numbers.

Measures of Central Tendency

These metrics help identify the “typical” or “middle” value in a dataset:

  • Mean: The arithmetic average. While commonly used, it is highly sensitive to “outliers”—single values that are much higher or lower than the rest.

  • Median: The middle value when data is sorted. This is the preferred measure for skewed data, such as household income, because a few billionaires won’t drag the median up the way they would the mean.

  • Mode: The value that appears most frequently, often used in categorical data like “most popular car color.”

Measures of Variability and Shape

Data isn’t just about the center; it’s about the spread. A narrow spread indicates consistency, while a wide spread suggests volatility.

  • Standard Deviation: This describes how much values cluster around the mean. In a “Normal Distribution” (the famous bell curve), roughly 68% of data falls within one standard deviation.

  • Skewness: This measures the asymmetry of the distribution. If the “tail” of the data stretches to the right, it is positively skewed.


2. Inferential Statistics: Predicting the Unknown

While descriptive statistics look backward at existing data, inferential statistics look forward. They allow us to take a small sample and make confident guesses about a much larger population. This is the logic that allows a poll of 1,000 people to represent the views of 300 million.

The Power of Hypothesis Testing

This is the scientific method in mathematical form. Researchers start with a Null Hypothesis ($H_0$)—the assumption that there is no effect—and use an Alternative Hypothesis ($H_1$) to suggest a change.

The $P$-value: This represents the probability that the observed results happened by pure chance. Generally, a $P$-value of less than 0.05 (5%) is considered “statistically significant,” meaning the result is likely real.

Correlation vs. Causation

One of the most famous rules in science is that correlation does not imply causation. Just because two variables move together—like ice cream sales and shark attacks—doesn’t mean one causes the other. Both are often influenced by a “lurking variable,” such as temperature.

Shutterstock
Explore


3. Advanced Modeling: Regression and Probability

In the 21st century, we use statistics to find relationships between variables. Linear Regression allows us to predict the value of one variable based on another. For example, a real estate agent might use regression to predict a house’s price based on its square footage.

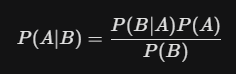
The Bayesian Revolution

Unlike “Frequentist” statistics, which look only at data from the current experiment, Bayesian Statistics incorporate “prior knowledge.” It treats probability as a “degree of belief” that is updated as new evidence comes in. This is exactly how your email spam filter works—it has a prior belief about what spam looks like and updates that belief every time you mark a new email as “junk.”


4. Statistics in the Wild: Why It Matters to You

In 2026, we are awash in data, but data without statistics is just noise. The applications are everywhere:

  • Healthcare: Clinical trials use randomized control tests to prove a drug’s safety. Without statistical rigor, we wouldn’t know if a vaccine works or if its effects are coincidental.

  • Business: Companies use A/B Testing to see which version of a website leads to more sales.

  • Technology: Machine learning—the backbone of AI—is essentially “statistics on steroids.” Algorithms use statistical patterns to recognize your face, translate languages, and drive cars.

The Data Revolution: Current Topics in Statistics

The field of statistics is undergoing its most significant transformation in decades. From the shift toward “Causal Inference” to the rise of “Synthetic Data” and real-time “Edge Analytics,” discover how modern statisticians are turning the noise of Big Data into the signal of truth on WebRef.org.

Welcome back to the WebRef.org blog. We have decoded the power structures of political science and the massive engines of macroeconomics. Today, we look at the mathematical “glue” that holds all these disciplines together: Statistics.

In 2025, statistics is no longer just about calculating averages or drawing pie charts. It has become a high-stakes, computational science focused on high-dimensional data, automated decision-making, and the ethical pursuit of privacy. Here are the defining topics in the field today.


1. Causal Inference: Moving Beyond Correlation

The old mantra “correlation does not imply causation” is finally getting a formal solution. Causal Inference is now a core pillar of statistics, using tools like Directed Acyclic Graphs (DAGs) and the Potential Outcomes Framework to determine why things happen, rather than just noting that two things happen together.

This is critical in medicine and public policy where randomized controlled trials (the gold standard) aren’t always possible. By using structural equation modeling, statisticians can “control” for variables after the fact to find the true impact of a new drug or a tax change.


2. Synthetic Data and Privacy-Preserving Analytics

As data privacy laws become stricter globally, statisticians have turned to a brilliant workaround: Synthetic Data. Instead of using real customer records, algorithms generate a completely fake dataset that has the exact same statistical properties as the original.

This allows researchers to study patterns—like disease spread or financial fraud—without ever seeing a single piece of private, identifiable information. This often goes hand-in-hand with Differential Privacy, a mathematical technique that adds a calculated amount of “noise” to data to mask individual identities while preserving the overall trend.


3. Bayesian Computation at Scale

Bayesian statistics—the method of updating the probability of a hypothesis as more evidence becomes available—has seen a massive resurgence. This is due to breakthroughs in Probabilistic Programming and Markov Chain Monte Carlo (MCMC) algorithms that can now handle billions of data points.

This approach is vital for Uncertainty Quantification. In 2025, we don’t just want a single “best guess”; we want to know exactly how much we don’t know, which is essential for autonomous vehicles and high-frequency trading.


4. Edge Analytics and IoT Statistics

With billions of “smart” devices (IoT) generating data every second, we can no longer send all that information to a central server.2 Edge Analytics involves running statistical models directly on the device—the “edge” of the network.

Statisticians are developing “lightweight” models that can detect a failing factory machine or a heart arrhythmia in real-time, using minimal battery power and processing strength.


5. High-Dimensional and Non-Stationary Time Series

In the era of 6G networks and high-frequency finance, data moves too fast for traditional models. Researchers are focusing on Long-Range Dependence (LRD) and the Hurst Exponent ($H$) to understand “memory” in data streams. This helps predict persistent trends in climate change and prevents crashes in volatile markets where the “random walk” theory fails.


Why Statistics Matters in 2025

Statistics is the gatekeeper of truth in an age of misinformation. Whether it is verifying the results of an AI model, auditing an election, or tracking the success of a climate initiative, statistical rigor is what separates a “guess” from a “fact.”

The Science of Uncertainty: An Introduction to Statistics

Welcome back to the webref.org blog. We’ve discussed the absolute certainties of Mathematics and the rigid rules of Logic. Today, we step into the real world—a place of messiness, randomness, and “maybe.” To make sense of this chaos, we use Statistics.

Statistics is the branch of science concerned with collecting, organizing, analyzing, interpreting, and presenting data. If Mathematics is the language of patterns, Statistics is the language of uncertainty. It allows us to turn a mountain of raw information into a clear, actionable story.


Descriptive vs. Inferential Statistics

In your studies, you will encounter two main “flavors” of statistics. Understanding the difference is key to interpreting any scientific study.

1. Descriptive Statistics

This is used to describe or summarize the characteristics of a dataset. It doesn’t try to make broad claims; it simply tells you what is happening right now in the group you are looking at.

    • Measures of Central Tendency: Mean (average), Median (middle), and Mode (most frequent).

    • Measures of Dispersion: Range, Variance, and Standard Deviation (how spread out the data is).

Shutterstock

2. Inferential Statistics

This is where the real power lies. Inferential statistics uses a small sample of data to make predictions or “inferences” about a much larger population.

  • Example: Testing a new medicine on 1,000 people to predict how it will work for millions.

  • Key Concept: The P-Value, which helps scientists determine if their results were a lucky fluke or a genuine discovery.


The “Normal” World: The Bell Curve

One of the most famous concepts in statistics is the Normal Distribution, often called the “Bell Curve.” In nature, many things—like human height, IQ scores, or even the weight of apples—tend to cluster around a central average.

When data follows this pattern, we can use it to make incredibly accurate predictions. For instance, we can calculate exactly how many people in a city will be over six feet tall, even without measuring every single person.

Shutterstock

The Danger Zone: Misleading with Statistics

Statistics are powerful, but they can be easily manipulated. As the saying goes, “Correlation does not imply causation.” Just because two things happen at the same time doesn’t mean one caused the other.

  • Example: Ice cream sales and shark attacks both go up in the summer. Does eating ice cream cause shark attacks? Of course not—the “hidden variable” is the heat, which makes people do both.

  • Sampling Bias: If you only survey people at a gym about their health, your results won’t accurately represent the general population.


Why Statistics is Your 2025 Survival Skill

In a world driven by “Big Data” and AI, statistical literacy is no longer optional. It is the filter that helps you navigate:

  1. Medical News: Should you be worried about a study that says a certain food increases cancer risk by 20%? Understanding absolute vs. relative risk helps you decide.

  2. Economics: Governments use statistics (like the CPI or GDP) to decide interest rates and social spending.

  3. Artificial Intelligence: Machine learning is essentially high-speed statistics. An AI doesn’t “know” things; it predicts the most statistically likely answer based on its training data.

  4. Sports: From “Moneyball” to modern basketball, teams use advanced analytics to find undervalued players and optimize strategies.


Final Thought: Finding the Signal in the Noise

The goal of statistics isn’t to be right 100% of the time—it’s to be less wrong over time. By learning to look at the world through a statistical lens, you stop seeing random events and start seeing the underlying probabilities that shape our lives.

The Architecture of Abstract Truth: An Introduction to Mathematics

Welcome back to the webref.org blog. We have explored the physical world through the Natural Sciences and the digital world through Computer Science. Today, we turn to the most universal language of all: Mathematics.

If science is the study of the universe, mathematics is the language in which that universe is written. It is a Formal Science that deals with the logic of shape, quantity, and arrangement. Unlike other sciences that rely on physical experiments, mathematics relies on proof—a logical demonstration that a statement is true in all cases, forever.


What is Mathematics?

Mathematics is often misunderstood as “the study of numbers.” While numbers are a major part of it, math is more accurately described as the study of patterns. Whether it’s the pattern of a seashell’s spiral, the movement of stock markets, or the orbits of planets, math provides the tools to model, measure, and predict these systems.


The Major Branches of Mathematics

Mathematics is a vast tree with many branches. Here are the primary areas you’ll find in our reference guide:

1. Arithmetic & Number Theory

The foundation of math. Arithmetic deals with basic operations (addition, multiplication), while Number Theory explores the deeper properties of numbers themselves, such as the mystery of prime numbers.

2. Algebra

Algebra is the language of relationships. By using symbols (like $x$ and $y$) to represent unknown values, we can create formulas that describe how one thing changes in relation to another.

3. Geometry & Topology

Geometry is the study of shapes, sizes, and the properties of space. Topology takes this a step further, studying the properties of objects that stay the same even when they are stretched or twisted (like a doughnut being topologically identical to a coffee mug).

4. Calculus

Developed by Newton and Leibniz, calculus is the study of continuous change. It allows us to calculate things that are constantly moving, such as the acceleration of a rocket or the rate at which a virus spreads through a population.

5. Statistics & Probability

These branches deal with uncertainty. Probability predicts how likely an event is to happen, while statistics provides the tools to collect, analyze, and interpret data to find the “signal” within the “noise.”


The Power of Mathematical Proof

In the natural sciences, a theory is “true” until new evidence proves it wrong. In mathematics, we use Axioms (self-evident truths) and Deductive Logic to create Proofs.

Once a theorem—like the Pythagorean Theorem—is proven, it is an absolute truth. It does not expire, it does not change with the weather, and it is true on the other side of the galaxy just as it is true here on Earth.

Getty Images


Why Math Matters in 2025

Mathematics is the invisible engine of the modern world. Without it, our current civilization would cease to function:

  • Cryptography: Your banking and private messages are kept secure by complex prime number math.

  • Architecture: Engineers use trigonometry and calculus to ensure bridges don’t collapse and skyscrapers can sway in the wind.

  • Machine Learning: Artificial Intelligence is essentially a massive system of linear algebra and multivariable calculus.

  • Medicine: Math models are used to understand the structure of proteins and the efficacy of new drug treatments.


The Beauty of Math

Beyond its utility, there is a profound beauty in mathematics. From the Golden Ratio found in nature to the infinite complexity of Fractals, math shows us that the universe is not a chaotic mess, but a structured and elegant system.

“Mathematics, rightly viewed, possesses not only truth, but supreme beauty.” — Bertrand Russell

The Architecture of Logic: Understanding the Formal Sciences

Welcome to webref.org. In our previous posts, we explored the physical world through the natural sciences and the human world through the social sciences. Today, we turn our attention inward to the Formal Sciences—the structural “skeleton” that holds all other disciplines together.

While a biologist might study a cell and an astronomer might study a star, a formal scientist studies the systems and rules used to describe them. They are not concerned with what is being measured, but how we measure and reason.


What are the Formal Sciences?

Unlike the natural sciences, which rely on empirical evidence (observation and experimentation), the formal sciences are non-empirical. They deal with abstract systems where truth is determined by logical consistency and proof rather than physical discovery.

The primary branches include:

  • Mathematics: The study of numbers, quantity, space, and change. It provides the universal language of science.

  • Logic: The study of valid reasoning. It ensures that if our starting points (premises) are true, our conclusions are also true.

  • Theoretical Computer Science: The study of algorithms, data structures, and the limits of what can be computed.

  • Statistics: The science of collecting, analyzing, and interpreting data to account for uncertainty.

  • Systems Theory: The interdisciplinary study of complex systems, focusing on how parts interact within a whole.


Why the Formal Sciences are “Different”

To understand the unique nature of these fields, we have to look at how they define “truth.”

  1. A Priori Knowledge: In physics, you must test a theory to see if it’s true. In formal science, truths are often discovered through pure thought. You don’t need to count every apple in the world to know that $2 + 2 = 4$; it is true by the very definition of the symbols.

  2. Absolute Certainty: Scientific theories in biology or chemistry are “provisional”—they can be updated with new evidence. However, a mathematical proof is eternal. The Pythagorean theorem is as true today as it was 2,500 years ago.

  3. Independence from Reality: A mathematician can create a “non-Euclidean” geometry that doesn’t match our physical world, and it is still considered “correct” as long as its internal logic is sound.


The Invisible Backbone of Modern Life

If the formal sciences are so abstract, why do they matter? Because they are the engine of application.

  • Encryption: Every time you buy something online, Number Theory (a branch of math) protects your credit card data.

  • AI and Algorithms: The “intelligence” in Artificial Intelligence is actually a massive application of Linear Algebra and Probability Theory.

  • Decision Making: Game Theory (a formal science) helps economists and military leaders predict how people will behave in competitive situations.

  • Scientific Validity: Without Statistics, a medical trial couldn’t prove that a drug actually works; it would just be a series of anecdotes.


The Intersection of Thought and Reality

The most profound mystery of the formal sciences is what physicist Eugene Wigner called “the unreasonable effectiveness of mathematics.” It is staggering that abstract symbols, cooked up in the human mind, can perfectly predict the movement of a planet or the vibration of an atom.

By studying the formal sciences, we aren’t just learning how to “do math”—we are learning the fundamental grammar of the universe itself.